Many MSP reports are data-heavy and decision-light. Clients get twelve charts and a 99.97% headline, but no clear signal on whether service is improving, what went wrong, or what happens next quarter. Worse, the headline number is often measured in a way nobody could defend if the client pushed back.
A strong SLA report answers three questions clearly:
- Are critical services meeting contracted reliability targets?
- Are incidents being resolved faster over time?
- Is communication quality improving during outages?
Direct Answer
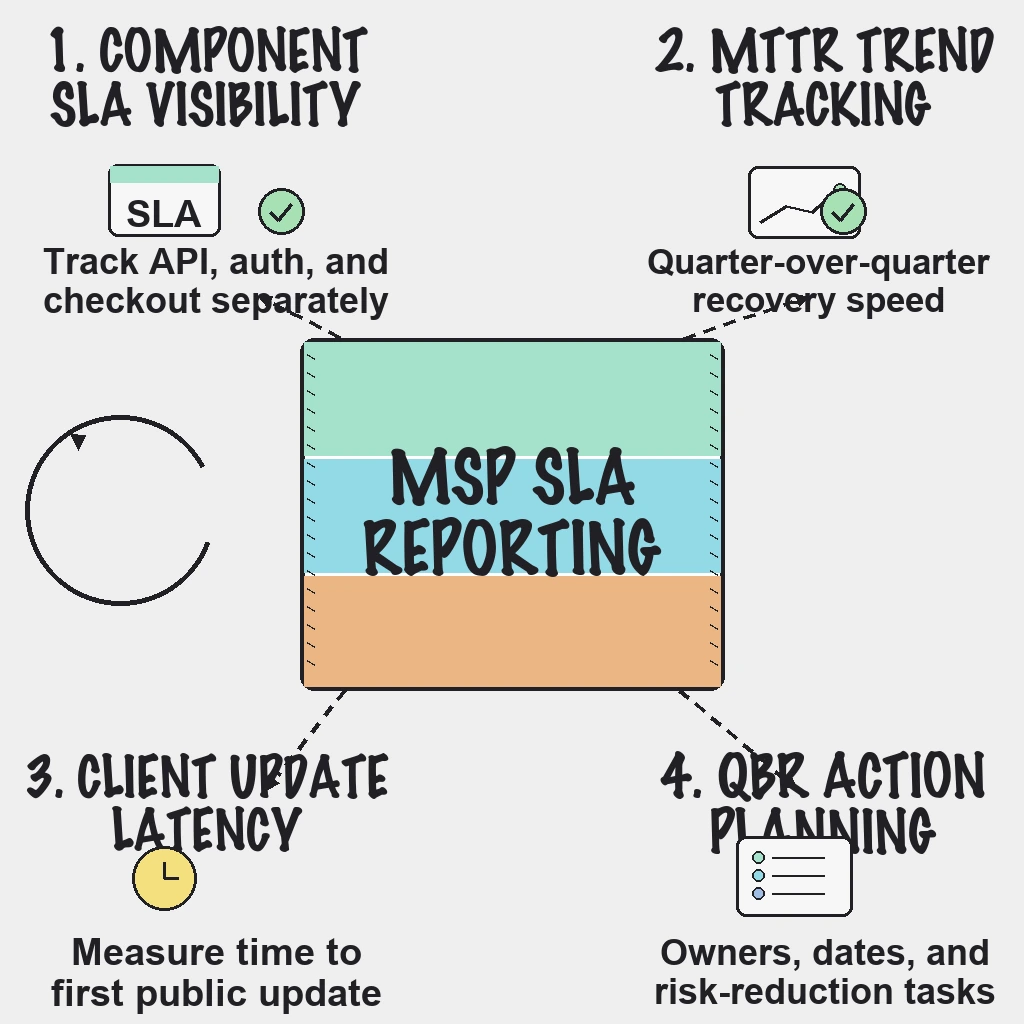
Report uptime per critical component, not one blended number, and define in writing what counts as downtime before the quarter starts. Lead with five metrics: SLA attainment by component, MTTR, false-positive alert rate, time to first client update, and repeat incident rate. Back every number with evidence (incident timelines and maintenance records), show quarter-over-quarter trend, and close with three named actions for next quarter.
Why This Matters
The QBR is where renewals are won or quietly lost. A client who sees a clear trend and a credible plan renews. A client who sees a wall of green, but remembers the Tuesday their checkout was down for an hour, concludes the report is marketing. Once a client stops trusting your numbers, every future incident becomes a negotiation.
SLA, SLO and SLI: Get the Words Right
- SLI (indicator): What you measure, such as the percentage of successful checks against the client's checkout endpoint.
- SLO (objective): The internal target you manage to, such as 99.95% monthly.
- SLA (agreement): The contractual promise, usually looser than the SLO, with consequences such as service credits.
Keep the SLO tighter than the SLA so you see trouble before it becomes a contract breach. The gap between them is your early warning.
What the Numbers Actually Mean
| Monthly target | Allowed downtime in a 30-day month |
|---|---|
| 99% | 7 hours 12 minutes |
| 99.5% | 3 hours 36 minutes |
| 99.9% | 43.2 minutes |
| 99.95% | 21.6 minutes |
| 99.99% | 4.3 minutes |
Two lessons hide in that table. First, the jump from 99.9% to 99.99% is the difference between one bad deploy and almost nothing, so do not sign 99.99% without architecture and staffing to match. Second, measurement resolution matters: with 2-minute checks plus confirmation, a single incident can consume most of a 4.3-minute budget before anyone is alerted. Check interval and target have to be chosen together.
Define Downtime Before You Measure It
Most SLA disputes are definition disputes. Agree these in writing per client:
- What counts as down: Failed checks confirmed from at least two monitoring regions, so one probe's network problem never counts against you or hides a real outage.
- Partial outages: Whether a degraded checkout counts as full downtime, half, or not at all.
- Exclusions: Scheduled maintenance announced in advance, client-caused changes, and failures of services outside your scope. Each exclusion needs a record, or it looks like an excuse.
- Measurement window: Calendar month is simplest to explain.
- Which MTTR: Mean time to restore, respond and resolve are different numbers. Pick one, name it, and keep it consistent.
Field note: Escalations go well when the evidence is ready before the call. An SLA number with a timeline, a maintenance log and a confirmed-failure rule behind it ends arguments; a number from a spreadsheet nobody can reproduce starts them.
Why Typical SLA Reports Fall Short
- Averaging away risk: One global uptime number hides critical component failures. Ten components at 100% and checkout at 98% averages to something that looks fine.
- No operational context: Clients see downtime minutes but not response quality or trend direction.
- Too many vanity charts: Lots of graphs, no action owner.
- Weak communication metrics: Incident transparency is rarely measured, even though clients feel it immediately.
QBR Scorecard: 5 Metrics That Matter
Use one page per client with these metrics first:
- SLA attainment by critical component: Uptime separately for API, auth, checkout, dashboard and integrations, against target.
- MTTR: Current quarter against previous quarter, with the definition in a footnote.
- False-positive alert rate: Alerts closed with no customer impact divided by all alerts. High noise means slower real response and on-call fatigue.
- Time to first client update: From confirmed incident to first message the client could see.
- Repeat incident rate: Incidents whose cause matches an earlier incident. This shows whether fixes stick.
If you can show only five metrics, these give the clearest executive signal. MTTA belongs in the operations section, not on the front page.
Recommended Report Structure
Section 1: Reliability Outcome Summary
- SLA status per component: met, at risk or missed
- Services with the highest incident impact
- Quarter-over-quarter reliability trend
Section 2: Incident Operations Quality
- MTTA and MTTR trend
- Top incident themes by cause
- False-positive reduction progress
Section 3: Communication Performance
- First update latency during incidents
- Update cadence adherence
- Post-incident summaries delivered on time
Section 4: Next-Quarter Reliability Plan
- Top three risk-reduction actions
- Owner and target date for each
- Contract or scope implications, if any
This keeps QBR discussions on accountability and forward movement.
Good Practice Versus Bad Practice
| Bad practice | Good practice |
|---|---|
| "99.97% uptime" across all services | Uptime per component against each target |
| Excluding outages after the fact | Exclusions defined in the contract, backed by records |
| Single-region checks as the source of truth | Multi-region confirmed failures |
| MTTR with no definition | Named metric, same definition every quarter |
| Listing incidents | Listing incidents with cause, fix and recurrence status |
Building the Report Without a Week of Spreadsheet Work
Treat the report as an output of your operating process, not a quarterly project. Record maintenance windows when you schedule them, keep incident timelines as you respond, and tag each incident with component and cause on closure. If that data exists, the report is assembly. If it does not, no template will save you.
Field note: The MSPs whose QBRs feel effortless are not better at slides. They built the paved road early: every client onboarded with the same monitor templates, component names and incident tags, so every report compares like with like.
How PingAlert Helps
PingAlert gives MSPs the evidence layer this kind of reporting depends on. Client workspaces keep each client's monitors, alerts, incidents and status pages separate under one subscription, with a portfolio view of health and active incidents. Checks run from multiple regions with quorum-based confirmation, maintenance windows keep planned work out of your alerts, and incident history and timelines record what happened and when. Monitor templates make onboarding consistent, so metrics compare cleanly across clients. See how it fits on the PingAlert for MSPs page, and the MSP uptime monitoring playbook for the operating model behind it.
Reader Questions, Answered
What is the most important metric in an MSP SLA report?
Uptime by critical component, not a single blended number. Clients care most about the services tied directly to revenue and operations.
Should MSPs include communication metrics in QBRs?
Yes. Communication speed and consistency directly affect client trust during incidents and should be measured as a service quality dimension.
How often should SLA reports be reviewed with clients?
Monthly operational reviews plus quarterly business reviews is a practical baseline for most MSP portfolios.
Should planned maintenance count against uptime?
Usually not, provided it was announced in advance under the terms in the contract. Overruns beyond the announced window should count.
Wrap Up
Great SLA reporting is not about longer dashboards. It is about making reliability quality obvious, measurable and defensible for each client. Define downtime first, measure from more than one place, and let the trend and the plan do the selling. For how agencies present similar data, see client reporting for agencies.
Ready to build QBR-ready uptime reporting on cleaner alerts and faster incident workflows? Compare plans on the pricing page.
Related guides:
- Agency incident response playbook
- Agency alert fatigue in website monitoring
- How synthetic monitoring helps
- Status page best practices for customer trust